Data Visualisation

What is Power BI?
Power BI helps teams implement business intelligence with ease. It is relatively simple to start building dashboards of interactive visualisations from a range of data sources, so you can start to see actionable insights very quickly.
Read More
What is data visualisation?
Data visualization is the graphic representation of data. It involves producing images that communicate relationships among the represented data to viewers of the images. Data visualisation empowers all of the teams in your organisation to make data-driven decisions and act on insights from your data.
Read More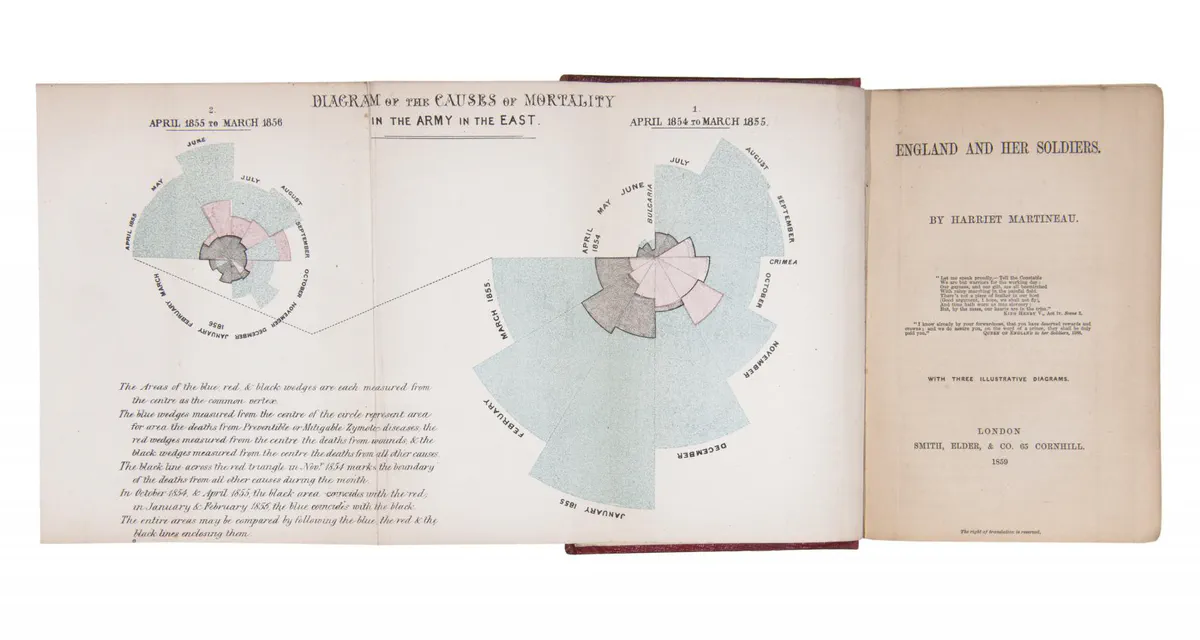
Florence Nightingale: Lighting the way in much more than healthcare
Many may think of Florence Nightingale as the incredible woman who reformed healthcare in ways that still impacts the industry today, but at Nightingale HQ we admire her for an additional reason.
Read More