Sustainability KPIs for Metals Supply Chains
- Steph Locke
- Blog
- September 23, 2026
- Updated:
Table of Contents Show Hide
Most metals Key Performance Indicator (KPI) packs look neat right up until you ask where the numbers came from. If you cannot trace a carbon figure, scrap rate, or recycled-content claim back to the job, batch, or cert, you are not measuring much.
The pain is simple. Too many teams still rebuild key numbers from PDFs, emails, paper notes, and battered spreadsheets.
Keep the KPI set tight. Start with the figures you can prove from live records. Then build out from there.
GoSmarter, built by Nightingale HQ, is the metals AI platform that links mill certificates, heat numbers and stock records. It reads certificates with AI-assisted Optical Character Recognition (OCR). It works alongside your Enterprise Resource Planning (ERP) system and Excel through CSV import/export and a REST API, with no rip-and-replace. You spend less time typing and less time arguing about whose spreadsheet is wrong.
What you should focus on:
- Track fewer KPIs, not more. Pick the ones tied to stock, scrap, supplier data, and carbon.
- Use both total and per-tonne figures. One shows scale. The other shows efficiency.
- Treat recycled content with care. High input scrap is not the same thing as circular use.
- Check supplier claims against proof. No heat link, no score you should trust.
- Test every KPI against live shop-floor records. If it only works in a month-end spreadsheet, bin it.
If the paperwork falls apart, the KPI falls apart with it.
Here’s the short version. The best KPI programme in metals starts at goods-in and follows the material through production. It ends with numbers you can still defend in an audit.
What is a sustainability KPI in a metals supply chain?
A sustainability KPI is a measured figure that tracks the environmental impact of making and moving metal. Examples include carbon per tonne, scrap rate and recycled content. In a metals supply chain, a sustainability KPI only counts if you can trace it to a specific heat number, batch or mill certificate. Without that link, it is an estimate, not evidence.
The KPIs that show where the real footprint sits
Once your data stops lying to you, track the KPIs that point to a specific supply-chain stage you can actually fix. Carbon is the first place to look. It shows where emissions sit, often long before material hits your gate.
Start with carbon, but don’t stop there
Start with Product Carbon Footprint (PCF). This is the total greenhouse gas (GHG) emissions per unit of product. You usually express it per tonne, in kilograms of carbon dioxide equivalent per tonne (kg CO2e/t) or tonnes (t CO2e/t). Split it into Scope 1, 2 and 3 first. Then add up the total. For any term you don’t recognise, see our metals manufacturing glossary.
The GHG Protocol sets the scope definitions. Scope 1 covers direct emissions from sources your organisation owns or controls. Think furnaces, on-site vehicles and combustion equipment. Scope 2 covers indirect emissions from purchased electricity, steam, heat and cooling. Scope 3 covers everything else: raw material extraction, upstream processing, logistics and end-of-life treatment. For many metals fabricators and stockholders, Scope 3 often holds most of the footprint. Most of the emissions happen at the mill, before the raw material reaches your site. A Taylor Steel greenhouse gas study found the same for service centres. Scope 3 was their single largest impact.
Production route matters. The Blast Furnace / Basic Oxygen Furnace (BF/BOF) route burns through coal and coke. An Electric Arc Furnace (EAF) can come in much lower, especially with renewable power and a high scrap share. worldsteel indicators put BF/BOF at about 2.2 tonnes of CO2 per tonne of crude steel. Scrap-based EAF comes in at about 0.3. Two suppliers can quote similar PCF figures and still run completely different processes. If you don’t know the route, the number tells you less than people pretend.
The KPIs your team can act on this month
From there, use operational KPIs to find the levers your plant can move now. Check which of these your records can already prove.
| KPI | Definition | Preferred Unit | Supply-Chain Stage | Likely Data Source | Main Limitation |
|---|---|---|---|---|---|
| Global Warming Potential (GWP), modules A1-A3 | GWP-total for the product stage, as stated in the supplier’s Environmental Product Declaration (EPD) to EN 15804+A2 | kg CO2e per declared unit (usually 1 tonne) | Cradle-to-gate (A1-A3) | Supplier’s verified EPD for that product, route and site, matched to the delivery via the heat number and mill cert | A site average over a period, not a per-heat figure; it expires |
| Product Carbon Footprint (PCF) | Total GHG emissions per unit of product, measured to ISO 14067 | kg CO2e / tonne | Cradle-to-gate (boundary set by the supplier) | Supplier PCF declarations, ideally third-party verified | Methods vary; use it only where no EPD exists |
| Energy Intensity | Energy consumed per unit of production | kWh / tonne | Production | Metering / utility bills | Doesn’t show energy source |
| Renewable Electricity Share (electricity only) | Proportion of electricity from renewable sources | % | Production | Renewable Energy Guarantees of Origin (REGOs) / Power Purchase Agreements (PPAs) | Site-specific |
| Material Yield | Ratio of finished product to raw material input | % | Fabrication | Production logs | Ignores upstream waste |
| Scrap Recovery Rate | Percentage of scrap generated that is recycled | % | Fabrication | Waste manifests | Manifests show tonnage sent, not whether it was remelted |
| Water Withdrawal | Total water taken from all sources | m3 | Production | Metering | Doesn’t show where water is lost |
| Air pollutants: particulate matter (PM), nitrogen oxides (NOx), sulphur oxides (SOx) | Mass of specific pollutants released | kg | Production | Stack monitoring | Needs specialised sensors |
The first two rows overlap on purpose. Both measure cradle-to-gate carbon per tonne. The EPD figure follows fixed EN 15804 rules, and a verified EPD has had an independent check. A PCF can use a looser boundary. So ask for the EPD first, and fall back on a verified PCF. Carbon Border Adjustment Mechanism (CBAM) data is a third, narrower figure. The next section explains the difference.
REGOs cover electricity only, so gas and other fuels need separate evidence. PPAs are stronger evidence than REGO-backed tariffs.
The same rule applies to every KPI: context matters as much as the number. Use both absolute and intensity KPIs.
- Absolute measures show total impact.
- Intensity measures let you compare like for like.
- You need both, because intensity can improve while total impact still climbs.
Recycled content is not the same as circularity
After carbon, the next trap is treating recycled content as proof of circularity. It isn’t.
Recycled content measures input only. Circularity also covers fabrication losses and end-of-life recovery. So high recycled content does not mean high circularity.
The split between pre-consumer and post-consumer scrap matters here. Pre-consumer scrap is manufacturing waste, such as fabrication offcuts, that leaves the process that made it. Under ISO 14021, scrap a mill remelts within its own process does not count as recycled content at all. Post-consumer scrap comes from products recovered at the end of their useful life. Only post-consumer scrap and pre-consumer scrap diverted from another process count towards recycled content. They mean very different things when you judge circularity. Recycled content only means anything when the scrap classification is traceable. Without that, the KPI is just a claim.
Ask what share of recycled content is post-consumer. That tells you whether you’re looking at end-of-life recovery or just manufacturing scrap.
The carbon figure UK customers ask for: GWP A1-A3 from an EPD
UK construction customers now ask for one specific carbon figure. They want the Global Warming Potential (GWP) for modules A1-A3. It comes from your supplier’s Environmental Product Declaration (EPD). The government’s Construction Products Reform White Paper confirms it. Buyers already ask manufacturers for product-level carbon data, “normally in the form of EPDs prepared in line with EN 15804”.
What GWP A1-A3 means in plain English
An EPD is an independently verified report on a product’s environmental impact. For construction steel, it follows EN 15804. The independent check follows ISO 14025. Every EPD names a programme operator, an issue date and a “valid until” date.
GWP is the EPD’s climate-change indicator. It comes in kilograms of carbon dioxide equivalent (kg CO2e) per declared unit. The declared unit for steel is often 1 tonne, but always check it. EN 15804+A2 splits GWP into four lines:
- GWP-total, the headline figure
- GWP-fossil, from fossil fuels
- GWP-biogenic, from biological carbon
- GWP-luluc, from land use and land-use change
The modules split a product’s life into stages. The London Plan whole life-cycle carbon guidance uses the same split:
- A1-A3, the product stage. Raw material supply, transport to the mill, and manufacturing. People call this “cradle to gate”.
- A4-A5. Transport to site, then construction and installation.
- B1-B7. The use stage.
- C1-C4. End of life, such as demolition, processing and disposal.
- D. Benefits and loads beyond the system boundary, such as future recycling.
Customers ask for A1-A3 because only the producer knows it. The project team works out transport and site work from its own records.
Here is a real example. British Steel’s EPD for rails and sections declares a GWP-total of 2,940 kg CO2e per tonne for A1-A3. It covers steel made at Scunthorpe and Teesside, using 2025 production data. The same EPD shows a module D credit of 1,740 kg CO2e per tonne for future recycling. Keep D separate. Never net it off the A1-A3 figure.
That A1-A3 figure is where the production route shows up. British Steel’s EPD puts almost all of its burden on turning iron ore into liquid steel. A scrap-based EAF supplier’s EPD reflects its own, very different process. Recycled content feeds into A1-A3 too. It still isn’t the same KPI, so track both.
Who asks for it, and what is actually mandatory
Most of the demand comes from contracts, not law. Here is the split as of October 2026.
Mandatory, in specific cases:
- London referable schemes. The London Plan requires a whole life-cycle carbon assessment for every application referable to the Mayor. After construction, the developer must submit “a list of product-specific EPDs for the products that have been installed”. So your customer needs your supplier’s EPD, matched to what you delivered.
- UK CBAM, from 1 January 2027. This is a legal duty on importers of iron, steel and aluminium. It uses verified installation emissions or default values, as the GOV.UK CBAM policy summary sets out. It does not ask for EPDs.
Client-driven:
- Building ratings and standards. BREEAM (Building Research Establishment Environmental Assessment Method) New Construction version 7 expanded whole-life carbon assessment. The UK Net Zero Carbon Buildings Standard published Version 1 in March 2026. Neither is a legal duty in itself, and both cover embodied carbon. Check the current version of each for its exact rules.
- Customer specifications and tender questions. Contractors pass these demands down the chain to you.
Proposals and guidance only, not law:
- Construction products reform. The 2026 white paper says EPDs for products outside a designated standard “will remain voluntary”. The consultation closed on 20 May 2026. The government has not yet published its response.
- Low carbon industrial products. The government will start its embodied emissions reporting framework on a voluntary basis. It covers steel, cement and concrete first. Buyer and producer guidance is due in 2027.
- Part Z. Part Z is an industry proposal to cap embodied carbon through the Building Regulations. The government has not adopted it.
- Public procurement. Procurement Policy Note 006 asks for a carbon reduction plan on major government contracts. Its five required Scope 3 categories leave out purchased goods. It does not ask for EPDs.
What to ask your supplier for
Use this checklist for every product line you buy:
- Product-specific or sector EPD. Ask for the EPD for your product, mill and route. A sector-average EPD suits early design work. It doesn’t prove what you supplied.
- The standard. EN 15804+A2 is current. The London guidance also accepts the older +A1 version, so record which one you have.
- Declared unit. Usually 1 tonne for steel. Check it before you compare anything.
- Modules. Make sure A1-A3 appears as its own figure, without module D netted off.
- Verification. Independent verification to ISO 14025, with the verifier named.
- Programme operator and EPD number. UK steel examples include CARES, BRE Global and Tata Steel UK’s own verified programme.
- Validity. Note the issue and expiry dates. EN 15804 allows five years. CARES-verified EPDs last three.
- GWP-total and GWP-fossil. Record both, so you can answer whichever one a customer asks for.
- Site and route. Which plant made it, and by blast furnace or electric arc furnace.
No EPD? Ask for a third-party verified carbon footprint to ISO 14067. The London guidance accepts one, but ranks it below an EN 15804 EPD.
How to record it against each order
An EPD covers a site’s output over a period. It doesn’t cover a single heat. British Steel’s 2026 EPD, for example, uses a full year of production data. The heat number on the mill certificate tells you which mill and product you received. That link lets you pick the right EPD for each delivery.
Treat it like any other KPI, with a clear owner and evidence:
| Field | GWP (A1-A3) KPI |
|---|---|
| Unit | kg CO2e per tonne (match the EPD’s declared unit) |
| Data source | Supplier’s EN 15804 EPD, matched to the delivery by heat number and mill cert |
| Frequency | Every delivery; recheck each EPD before it expires |
| Owner | Purchasing collects the EPDs; quality links them to heats |
| Verification | Independently verified EPD, in date when you buy |
For each delivery, record the order, supplier, mill, product, heat or lot number and tonnes. Add the EPD number, programme operator, GWP-total per tonne and expiry date. Then multiply GWP per tonne by tonnes delivered, and add up each job. CARES describes this same method for as-built rebar.
Here is the loop from request to report.
flowchart LR
    A([Order placed]) --> B[Ask mill for EPD\nproduct, site, route]
    B --> C{Checks pass?\nEN 15804, A1-A3,\nverified, in date}
    C -- No --> B
    C -- Yes --> D[Delivery arrives\nheat number on mill cert]
    D --> E[Record GWP A1-A3,\nEPD number and expiry\nagainst the order]
    E --> F[Tonnes x GWP\nper job]
    F --> G([Customer return,\ntender or Scope 3 report])
    G -. EPD expires .-> B
You ask for the EPD when you order and check it. You match it to the delivery by heat number, then record the figure against the order. Totals go to customers and into your own reports. When the EPD expires, you ask again.
How to use it
- Customer questionnaires and as-built returns. Give GWP per tonne, the EPD reference and the tonnes, job by job.
- Tenders. List the product-specific EPDs you hold, with their expiry dates.
- Your own Scope 3 reporting. Purchased steel sits in Scope 3 Category 1, purchased goods and services. Supplier EPD figures give you a closer estimate than a generic average.
The pitfalls that sink the number
- Mismatched units or modules. Don’t compare a per-tonne A1-A3 figure with a per-kilogram or A1-A5 one.
- Expired EPDs. Check the date on every EPD, every time.
- Sector averages dressed up as product data. A sector EPD is fine at design stage. It isn’t evidence of what you delivered.
- Mixing GWP with CBAM figures. UK CBAM covers direct embedded emissions, including precursors. EPDs cover more. Research for the government found EU CBAM results typically run 8-15% below the EPD for the same product. Keep the two figures apart.
What GoSmarter does and doesn’t do here
GoSmarter links each heat number and mill certificate to your stock and the orders you supply. That gives you the delivery-to-mill match you need to pick the right EPD. GoSmarter does not store EPD or emissions data today. Keep your EPD register alongside it. You can export stock, orders and certificates as CSV, then join them to the register by heat number.
What to do this quarter
- List your top suppliers by tonnage. Ask each one for current EN 15804+A2 EPDs.
- Build the register, and fill it in for every delivery.
- Put every EPD expiry date in the diary.
- Ask your customers which GWP figure and format they need.
- Keep CBAM data in its own record, separate from EPD figures.
If you can’t trace the heat number, your supplier KPI is probably guesswork
The same traceability gap that warps recycled-content claims also wrecks supplier reporting. A supplier KPI only means anything when you can tie each claim to a heat number, batch or coil. If you can’t, the scorecard won’t survive an audit.
Mill certificates only matter when you digitise them and link them to stock. A folder full of stray PDFs is paperwork, not integrated cert traceability. Once you tie traceability to stock, supplier KPIs stop being admin theatre and start showing evidence.
The supplier metrics that hold up in an audit
The supplier KPIs that matter are the ones you can check against records.
| Metric | What it shows |
|---|---|
| Heat number traceability | Whether deliveries link to a specific heat, batch or coil |
| Mill-certificate completeness | Whether the supplier sends every document you need for traceability |
| Verified emissions data coverage | Whether traceable records back up the emissions claims |
| Recycled-content verification rate | Whether you can confirm recycled-content claims against records |
| Supplier environmental-assessment coverage | How much of the supply base you have assessed |
| Low-carbon procurement share | Whether purchasing is shifting towards lower-emission sources |
| Corrective-action closure rate | Whether suppliers resolve the issues you raise |
| Responsible-sourcing incident rate | How often you record upstream problems |
| Supplier data-quality score | Whether you can rely on the data |
How to tell if a supplier is fixing problems or just filing paperwork
A high corrective-action closure rate sounds good. It only counts if the supplier has actually fixed the problem. If incidents keep turning up and closures drag on or stay half-done, your scorecard shows motion, not progress.
When you digitise the link between inventory and heat codes, supplier records turn into proof you can check. Those same links also keep scrap, stock and transport KPIs honest.
The KPIs behind scrap, stock and transport
Once you sort supplier traceability, those same records should feed your scrap, stock and transport KPIs too. Skip it, and recycled-content claims, yield, and freight emissions go fuzzy fast.
Where circularity works and where it falls apart
Track scrap and offcuts at job level, at the point of use. If you rely on end-of-shift estimates, you’re not measuring circularity. You’re guessing.
The planning KPIs that quietly push emissions up
Circularity improves when planners can actually see offcuts. Not when they’re buried in notebooks, sat in someone’s head, or hiding in a tired spreadsheet.
Inventory age and obsolete-stock rate give you the first warning. If quotes go stale, people buy stock that’s already sitting on the shop floor. Often it’s there as offcuts or remnants. Then the mess snowballs. A stale quote kicks off a rush order and extra freight. Transport emissions climb for no good reason. Meanwhile, the offcut that could have done the job sits unlogged, and planners can’t use it.
Use suitable offcuts before cutting new stock. Sort cut patterns across multiple orders. You cut scrap and dodge extra freight at the same time.
How to stop paper certificates and scrap spreadsheets distorting your numbers
KPI numbers you can trust need clear definitions. They also need an audit trail that holds up under pressure. Without that, two sites in the same business can work out scrap rate in two different ways. Then the group number means next to nothing.
Manual mill-certificate entry eats hours that should go on the numbers themselves. At Midland Steel, an Irish rebar manufacturer with UK and Norway plants, MillCert Reader saved its production manager 10 hours a month of certificate admin. The same manual slowdown shows up everywhere else too:
- Teams rebuild scrap figures at month-end from notes and memory.
- Someone types the same heat numbers into several systems.
- People patch together CBAM records from scattered emails and customs paperwork.
If nobody captured verified emissions data on arrival, EU CBAM rules fall back on default emission values. These defaults are usually higher than verified actual figures, which can push up the CBAM cost on your imports. The EU sets defaults conservatively, with a mark-up of 10% in 2026, 20% in 2027 and 30% from 2028 (Implementing Regulation (EU) 2025/2621). The UK CBAM starts on 1 January 2027 and covers iron, steel and aluminium. UK fabricators face the same default-value problem.
GoSmarter digitises mill certificates and links them to stock by heat number. The same heat-number link connects MillCert Reader, Metals Manager and Cutting Plans. Metals Manager keeps every offcut on record with its heat code. Cutting Plans works out cut patterns across multiple orders to keep waste down, and shows the reusable offcut and scrap left on each bar.
The biggest gaps sit here:
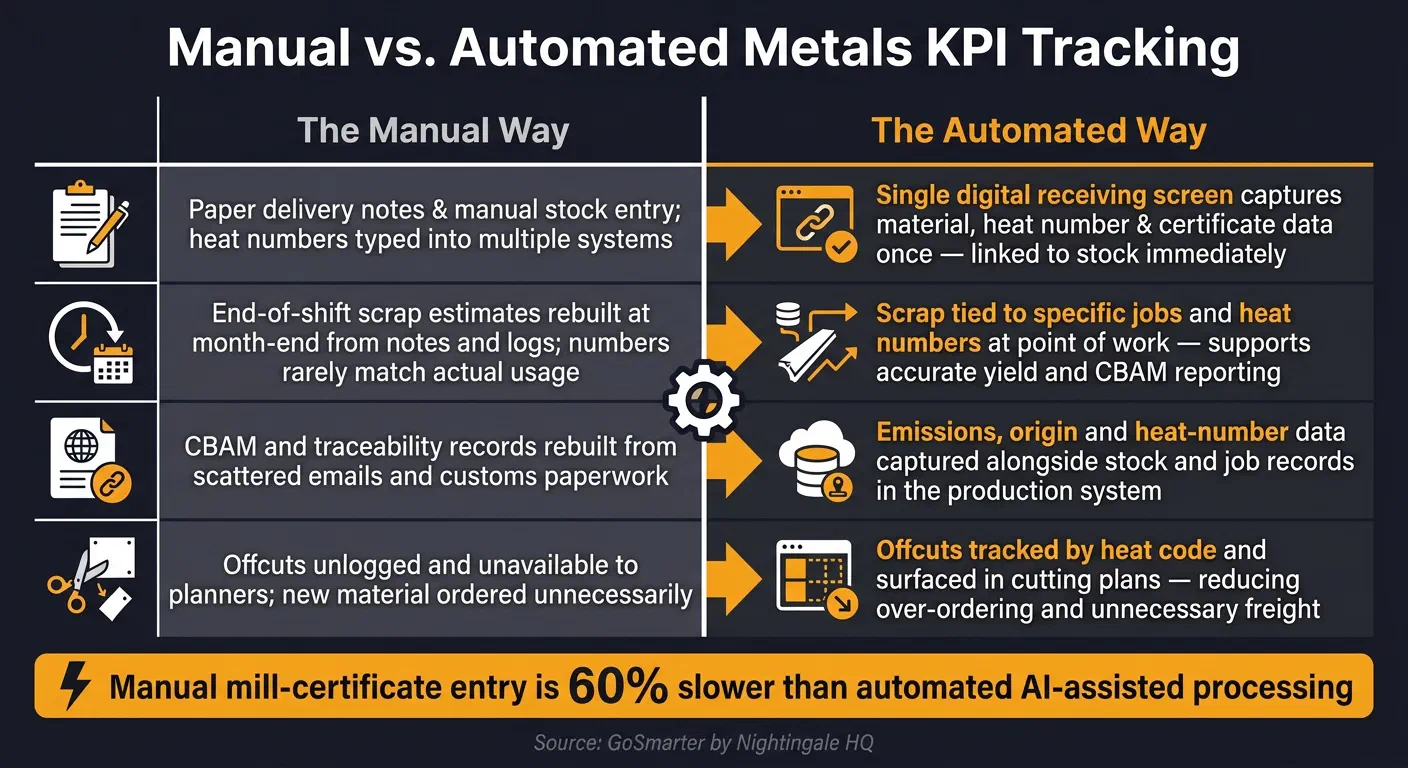
| The Manual Way | The Automated Way |
|---|---|
| Paper delivery notes and manual stock entry; heat numbers typed into multiple places | Stock recorded with its heat number once, and GoSmarter automatically links it to the matching digitised mill certificate |
| End-of-shift scrap estimates rebuilt at month-end from notes and logs; numbers rarely match actual usage | Scrap weights logged by bin or skip in a dated, audited scrap log, and planned offcut and scrap per bar recorded against each cutting plan |
| CBAM and traceability records rebuilt from scattered emails and customs paperwork | Origin, heat-number and certificate data captured once and kept with stock records, ready to support emissions reporting |
| Offcuts unlogged and unavailable to planners; new material ordered unnecessarily | Offcuts kept on record by heat code, with offcut and scrap per bar shown on each cutting plan |
Record material and heat number once when it arrives, and let the linked certificate flow through scrap, stock and transport KPIs.
Start small, test your KPI set and build from live data
Once you link heat numbers and certificates to stock, test only the KPIs your records can back up.
Keep the pilot small. Set clear boundaries, units and proof for each KPI. Then check each one against live production records, not guesses dressed up as data.
| KPI | System Boundary | Units | Audit Evidence |
|---|---|---|---|
| Embodied carbon (GWP A1-A3) | Cradle to mill gate; transport to you tracked separately | kg CO2e/t | In-date, verified EPDs per supplier and product, matched to heats through mill certs |
| Scrap rate | Shop floor / cutting | % | Dated scrap logs |
| Recycled content | Supplier / mill input | % | Supplier declarations, mill certs |
| Traceability rate | Goods-in to dispatch | % | Heat-code to cert digital links |
Pick one current production period. Test each KPI against live records such as mill certificates, heat numbers, scrap logs and stock movements. You’ll spot the truth fast. Some KPIs stand up. Others still rely on estimates, patched-together spreadsheets, or plain guesswork.
GoSmarter uses MillCert Reader to digitise mill certificates and link them to stock. That link gives you traceability from the mill certificate to the stock you hold and the orders you supply, ready to pull into a certificate pack. MillCert Reader comes with the Workshop plan at £350/month rolling, or £280/month billed annually, and most teams go live in less than a month. Using the Midland Steel numbers, the saved admin time covers the upfront annual subscription in about 11 months. That estimate divides annual cost by the monthly value of admin hours saved. The ROI worked example shows the full calculation.
The same linked records keep CBAM and recycled-content checks traceable. They also show which KPIs are ready for reporting, and which ones still need proper evidence.
FAQs
Which sustainability KPIs should we start with?
Start with three KPIs you can measure from traceable production data:
- Embodied carbon, as GWP A1-A3 from each supplier’s EPD, matched to heats through mill certificates
- Scrap and waste rate, including scrap weight and reason
- Data traceability and completeness, such as how fast you can link mill certificates and heat numbers to melts, chemistry and test results
These give you a baseline you can defend in an audit. They also show where to fix the paperwork first.
How do we prove recycled-content claims?
Proving recycled-content claims takes clear material traceability. You need production records tied straight to the source data. Capture scrap weight and reason at the point of work. Don’t rebuild the numbers later from manual logs. That’s where the faff starts.
Link that data to each job and heat number. You then have an audit trail that stands up in a compliance check. GoSmarter, built by Nightingale HQ, helps by digitising mill certificates and tracking material traceability. That keeps your data clean, linked, and ready for inspection.
Why is heat-number traceability so important?
Heat-number traceability ties a physical item to its mill test certificate. You get a checked record of its chemistry and mechanical properties. That matters because you need proof the material meets the required standard for the job.
If traceability falls apart, the wrong material can end up in a critical order. That’s how you get safety risks, failed checks, and non-conformance. It also lets you match each delivery to the supplier installation’s CBAM emissions data.
What is the difference between Scope 1, 2 and 3 emissions for a metals manufacturer?
What is GWP A1-A3 in an EPD, and what should we ask our steel supplier for?
GWP A1-A3 is the Global Warming Potential of the product stage, from raw materials to the mill gate. It sits in the supplier’s Environmental Product Declaration (EPD) to EN 15804, in kg CO2e per declared unit. For steel, that unit is often 1 tonne.
Ask for a product-specific EPD to EN 15804+A2 for your product, mill and route. Check the declared unit and the A1-A3 figure on its own. Check for verification to ISO 14025, the programme operator and the expiry date. Record GWP-total and GWP-fossil against each order, matched by heat number.
Do UK metals suppliers have to provide an EPD by law?
Where does GoSmarter store our data, and can we get it out?
GoSmarter stores your data on Microsoft Azure in UK data centres. AI extraction may run outside the UK. You can export your stock, orders, certificates and scrap logs as CSV, or pull data through the REST API.
We use uploaded certificates, de-identified, to improve our own extraction models. We never share them with other customers or third-party AI providers. Microsoft does not train on your data.
Drill deeper
- Your Factory Dashboard Is Missing These KPIs
Go here for operational measures such as overall equipment effectiveness beside the carbon ones.
18 min read
- The EU Just Slashed CSRD Scope by 90%. What It Means for Metals Manufacturers
Go here for what the 2026 EU reporting cuts change, and what they leave alone.
4 min read
About the Author

Co-founder & Head of Product
Steph Locke is Co-founder and Head of Product at GoSmarter AI — former Microsoft Data & AI MVP building practical tools to cut paperwork and automate compliance for metals manufacturers.