Reports supported by AI & automation
- Steph Locke
- Archive
- May 11, 2021
- Updated:
Table of Contents
Many organisations have to combine a mixture of qualitative and quantitative information to provide some sort of output document. Common situations include:
- Compiling a response to a Request For Tender (RFT)
- Performing design, review, and/or discovery services
- Creating specifications
- Surveys
- Board reports The compilation of data from different sources is incredibly time consuming and doesn’t leave the person creating report as much time to think on the recommendations or outcomes they’re trying to achieve. This is where automation and artificial intelligence (AI) come in.
Gathering data
The first step is to build a model called a taxonomy or structure to represent your work. This could be areas like:
- Interviews: Person, Interview text, Key findings
- Employee surveys: (optional) Person, Question & Answer pairs
- Documents: Document, Purpose, Key content, Key findings
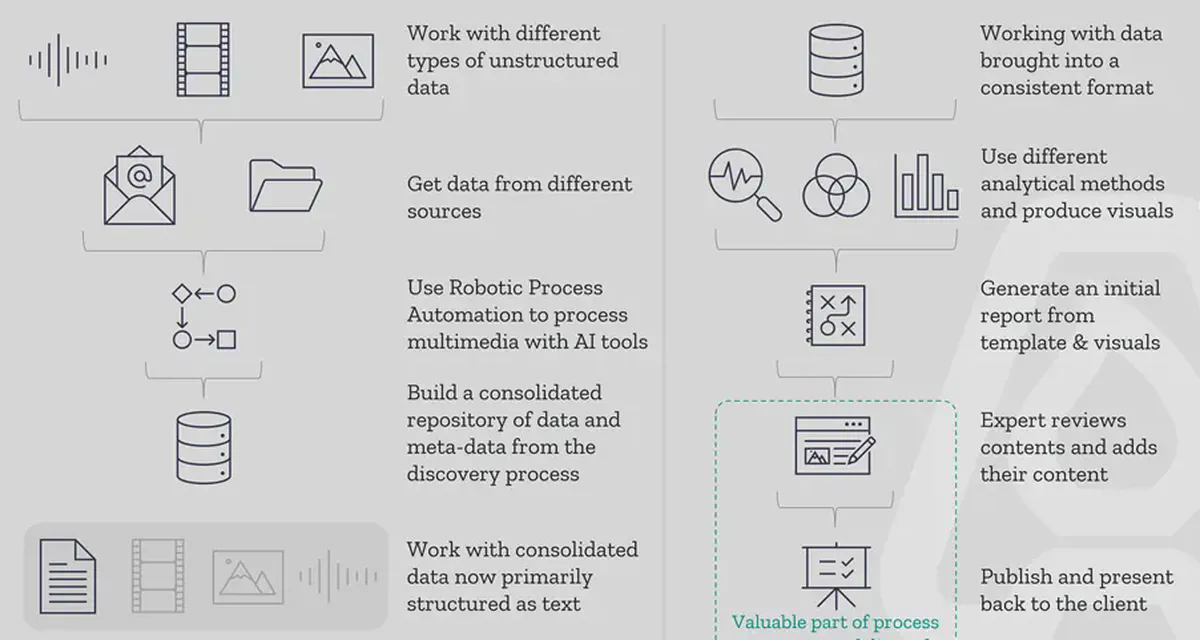
We can use AI to turn things like videos, audio recordings, and PDFs into analysable text that can be stored in structures that map to your model of different sources. This can even be done through automation. With no-code solutions like Microsoft’s Power Automate you can detect new videos, send them to the AI software to transcribe, then output the results to your data storage.
Converting data into insight
With the data in a ready to analyse format, you can now create a template document that includes the integrations to produce things like charts, word clouds, key findings and so forth. This concept isn’t new – it’s called literate programming and has been around since the seventies. This template can be produced in many different platforms but the one you might see the cool kids (aka data scientists) using is Jupyter notebooks. You could even do all of this in Power BI and export to PDF!
The key is to start identifying what you want included in all documents of whatever type you’re automating and then build those visualisations or analysis in. This can include off-the-shelf AI tools like Microsoft Text Analytics, or it could include your code using open-source libraries for things like anomaly detection. You can even programmatically generate text based on the data and analysis.
Once you have the template, you can then say which customer / client / month / product you want to generate a report for and it will pre-fill all the visuals and allow you to spend time writing the text.
AI and automation save time
Using this no-code approach to gathering unstructured data using AI, making it available in an easy to consume dataset, and then building template reports with the analytics necessary is an investment in scale and building better quality reports. Using templates reduces user-error and gives more time for quality insights instead of spending precious staff time on getting those charts to look just right! The great thing about this process of automating this area is that it isn’t an all or nothing approach. You can start with an automation to transcribe interviews, or create the template with just some of the visuals in. Building this up over time is possible as people’s skills grow.
This is a no-brainer continuous improvement project for your organisation.