Embodied Carbon A1-A4: A Guide for UK Metal Fabricators
- Steph Locke
- Blog , Learning
- October 6, 2026
- Updated:
Table of Contents Show Hide
A customer asks for the embodied carbon of your last order. You need three things: each supplier’s verified figure, the tonnes you used, and your delivery records. Multiply tonnes by each mill’s figure. Add your yield losses. Add the lorry. That covers what is yours to report.
The hard part isn’t the sum. It’s finding the right supplier document for each delivery, in date, and proving the match. Our sustainability KPIs guide explains the supplier figure and what to ask mills. This guide covers the arithmetic, the records and the decisions.
What A1-A3, A4 and the later stages mean for a fabricator
Carbon reports for buildings split a product’s life into modules. The London Plan whole life-cycle carbon guidance follows BS EN 15978. It also follows the Royal Institution of Chartered Surveyors (RICS) standard:
- A1-A3, the product stage. Raw materials, transport to the factory, and manufacturing. People call it “cradle to gate”.
- A4, transport to site. The guidance describes it as transport “from fabrication to site”.
- A5, construction and installation. On-site assembly, temporary works and site energy.
- B1-B7, the use stage, and C1-C4, end of life.
- D, beyond the system boundary. Future reuse and recycling, reported separately.
For your business, the split works like this.
A1-A3 comes mostly from your mill. The supplier’s Environmental Product Declaration (EPD) to the European standard EN 15804 gives its Global Warming Potential (GWP) per declared unit. For steel, that unit is usually 1 tonne. The London guidance counts “the level of waste associated with the manufacture of the product” in A1 and A3. It puts fabricating processes in A3 too. So your cutting losses push up the A1-A3 figure for what you deliver. So does your own processing energy, if your customer asks you to include it.
A4 is your delivery. A mill’s EPD may not declare it. British Steel’s rails and sections EPD, for example, marks A4 and A5 as “module not declared”. The mill can’t know where you will send the steel. You can.
A5 onwards belongs to the customer. Your job there is to supply clean data, not to calculate their figures.
Module D is a separate credit. It estimates the benefit of recycling the steel in future. Report it on its own line. Never subtract it from A1-A3.
Here is who owns which stage.
flowchart TD
    A["Mill: A1-A3 in its EPD"] --> B["You: cutting losses and processing"]
    B --> C["You: A4 delivery to site"]
    C --> D["Customer: A5 installation"]
    D --> E["Customer: B use and C end of life"]
    E --> F["Module D: separate line"]
The mill’s EPD sets the starting figure. Your yield and delivery add to it. The customer owns everything after that.
How to measure it
You don’t need a consultant for the basic sum. The UK Certification Authority for Reinforcing Steels (CARES) sets out the method for as-built reinforcing bar in its 2024 paper on UK rebar carbon. Multiply each supplier’s GWP by the mass you bought from them. Add up the results. Then add transport for each supplier. The same logic works for sections, plate and aluminium.
Step 1: get the right data from each mill
Get the current EPD for every product line you buy. The KPIs guide has the full supplier checklist. In short, record:
- the EPD number, programme operator and verifier
- the standard (EN 15804+A2, or the older +A1)
- the declared unit, usually 1 tonne
- GWP-total for A1-A3, separate from module D
- the mill, site and production route
- the issue and expiry dates
Watch the expiry date. CARES notes that EN 15804 allows up to five years, but CARES-verified EPDs last three. An EPD also averages a year of a site’s output. It doesn’t describe a single heat.
Step 2: build a per-order figure
The heat number on each mill certificate tells you which mill and product you received. That link lets you pick the right EPD for each bar, plate or coil. Then the formula is simple:
A1-A3 for the order = sum of (tonnes consumed from each supplier x that supplier’s GWP per tonne)
“Tonnes consumed” means what the order used up: the steel delivered plus the scrap it created. Reusable offcuts go back into stock. They carry their own heat number and their own EPD into the next job.
Step 3: account for scrap and yield
Yield changes the figure per tonne delivered. If you lose a fifth of the steel to scrap, each delivered tonne carries the carbon of 1.25 tonnes consumed. The formula is:
A1-A3 per tonne delivered = (A1-A3 for the order) / (tonnes delivered)
Agree with your customer which basis they want. Some ask per tonne delivered. Others ask for tonnes installed and the supplier’s GWP, and apply their own wastage rate. State the basis every time.
The scrap you sell for recycling doesn’t earn you a deduction here. Its future benefit belongs in module D, on a separate line.
Step 4: add A4 transport
The Department for Energy Security and Net Zero (DESNZ) publishes greenhouse gas (GHG) conversion factors each year. The 2026 edition came out on 11 June 2026. Its “Freighting goods” sheet gives factors per tonne-kilometre (tonne.km). It sets an order of preference:
- Fuel used. Litres of fuel, or kilowatt-hours (kWh) for electric vehicles, give the most accurate result.
- Vehicle distance. For vans and Heavy Goods Vehicles (HGVs), vehicle-kilometre data beats tonne.km.
- Tonne.km. Tonnes carried times distance, times the factor for the vehicle type.
For reference, the 2026 “Freighting goods” sheet gives 0.10356 kilograms of carbon dioxide equivalent (CO2e) per tonne.km. That is for an average non-refrigerated diesel HGV at average load. Pick the row that matches your lorry. Record the edition and the row you used.
Own lorries? Use your fuel records. Haulier? Ask for fuel or distance per job.
Step 5: record the sources
For each order, record the heat numbers, mills and tonnes consumed per heat. Add the EPD number, GWP and expiry date for each heat. Then add tonnes delivered, delivery distance, vehicle and the factor edition. Note who did the sum, and when.
Those records also match what London asks for. After construction, a London referable scheme must submit “a record of material delivery including distance travelled and transportation mode”. It must also list “product-specific EPDs for the products that have been installed”.
A worked example with hypothetical numbers
We invented these figures to show the arithmetic. They are not real product data.
- Mill A: 15 tonnes consumed, hypothetical GWP A1-A3 of 1,000 kg CO2e per tonne
- Mill B: 10 tonnes consumed, hypothetical GWP A1-A3 of 2,000 kg CO2e per tonne
- Delivered to site: 20 tonnes, so 5 tonnes of scrap and a yield of 80%
- Delivery: 100 km by lorry, with an illustrative factor of 0.1 kg CO2e per tonne.km
The sums:
- Mill A: 15 x 1,000 = 15,000 kg CO2e
- Mill B: 10 x 2,000 = 20,000 kg CO2e
- A1-A3 for the order: 15,000 + 20,000 = 35,000 kg CO2e
- Average per tonne consumed: 35,000 / 25 = 1,400 kg CO2e per tonne
- Per tonne delivered: 35,000 / 20 = 1,750 kg CO2e per tonne
- A4: 20 tonnes x 100 km x 0.1 = 200 kg CO2e
Two things stand out. The 80% yield adds 350 kg CO2e to every delivered tonne. And in this example, the mill matters far more than the lorry.
For scale, here is one real published figure. British Steel’s rails and sections EPD, under the Tata Steel UK programme, declares 2,940 kg CO2e per tonne for A1-A3. That covers 2025 production at Scunthorpe and Teesside, by the blast furnace route.
How to manage it
Supplier and route choice
The mill’s production route drives most of the A1-A3 figure. The CARES paper quotes worldsteel 2022 averages. It gives about 2.3 tonnes CO2e per tonne for the Blast Furnace-Basic Oxygen Furnace (BF-BOF) route. Scrap-based Electric Arc Furnace (EAF) steel averages about 0.7, with a range of 0.2 to 1.1. Those are global averages, not your supplier’s EPD. Always use the EPD for the product you actually bought.
Grade, lead time and price still matter. But if two mills can meet the spec, the EPD gives you a fair way to choose.
Scrap and yield
Every tonne of scrap carries its full A1-A3 figure into your delivered product. Cutting scrap cuts carbon and cost together. Use offcuts before prime stock. Plan cuts across orders. Log scrap by job and heat at the point of work, not at month-end.
Delivery planning
Full loads and planned routes reduce A4 per tonne. In the worked example, A4 is small next to A1-A3. But it is entirely yours to improve.
Data hygiene and an EPD register
Keep one EPD register, with a row per EPD and the fields from Step 1. Join it to your stock and order exports by heat number. Set a reminder three months before each EPD expires. Record the version used for each order, so you can rerun old figures.
Who owns what
| Task | Typical owner |
|---|---|
| Request and file supplier EPDs | Purchasing |
| Link heats and certificates to stock | Quality |
| Log scrap and yield by job | Operations |
| Record delivery distance and vehicle | Transport or despatch |
| Calculate and sign off order figures | Quality or commercial lead |
| Answer tender and customer questions | Commercial |
Here is the full loop.
flowchart TD
    A["Collect EPDs and delivery data"] --> B["Link to heats in the EPD register"]
    B --> C["Calculate A1-A3 and A4 per order"]
    C --> D["Report to customer or tender"]
    D --> E["Review mills, yield and routes"]
    E --> A
You collect the data, link it by heat number and run the sum. Then you report it, and use what you learn to choose mills, cut scrap and plan loads.
Where GoSmarter fits
GoSmarter, built by Nightingale HQ, links heat numbers and mill certificates to stock and orders. MillCert Reader reads the certificate and keeps that link. Metals Manager keeps every offcut on record with its heat code, and GoSmarter keeps a scrap log. That gives you the delivery-to-mill match and scrap records to review your yield.
GoSmarter does not store EPD or emissions data today. Keep your EPD register alongside it. Export stock, orders and certificates as comma-separated values (CSV) files. Or connect through the Application Programming Interface (API). Then join them to the register by heat number. GoSmarter stores your data on Microsoft Azure in UK data centres. GoSmarter uses de-identified certificates to improve its own extraction models. It never shares them with other customers or third-party AI providers.
What it means for the business
Here is what UK customers can demand, as of October 2026.
Mandatory, in specific cases:
- London referable schemes. London Plan Policy SI 2 requires a whole life-cycle carbon assessment for every application referable to the Mayor. The post-construction evidence includes delivery records and product-specific EPDs. Your customer carries the duty, and passes the data request to you.
- RICS members. The RICS whole life carbon standard, 2nd edition, took full effect on 1 July 2024. RICS members must follow it when they carry out an assessment. That is a professional rule, not a law. The Greater London Authority (GLA) guidance still rests on the 1st edition, and the GLA is considering updates.
- UK CBAM from 1 January 2027. The Carbon Border Adjustment Mechanism (CBAM) applies to imported iron, steel, aluminium and some other goods. The GOV.UK policy summary makes the importer liable, with a £50,000 registration threshold. It charges on direct embedded emissions, from verified installation data or default values.
Client-driven:
- BREEAM. The Building Research Establishment Environmental Assessment Method (BREEAM) rates buildings. BREEAM version 7 expanded whole-life carbon assessment, including embodied carbon. Version 7.1 is now the default.
- UK Net Zero Carbon Buildings Standard. It is a voluntary standard. Version 1 came out in March 2026, and verification launched in July 2026.
- Contractor specifications and questionnaires. The government’s own Construction Products Reform White Paper notes buyers already ask for EPDs “prepared in line with EN 15804”.
Proposals, not yet law:
- Construction products reform. The white paper says an EPD for products outside a designated standard “will remain voluntary”. The consultation closed on 20 May 2026. The government is still analysing responses.
- Low carbon industrial products. DESNZ published its response on 28 May 2026. Its embodied emissions reporting framework will start on a voluntary basis. It will keep a mandatory approach under review. It intends to publish buyer and producer guidance in 2027.
Don’t mix up CBAM and EPD figures
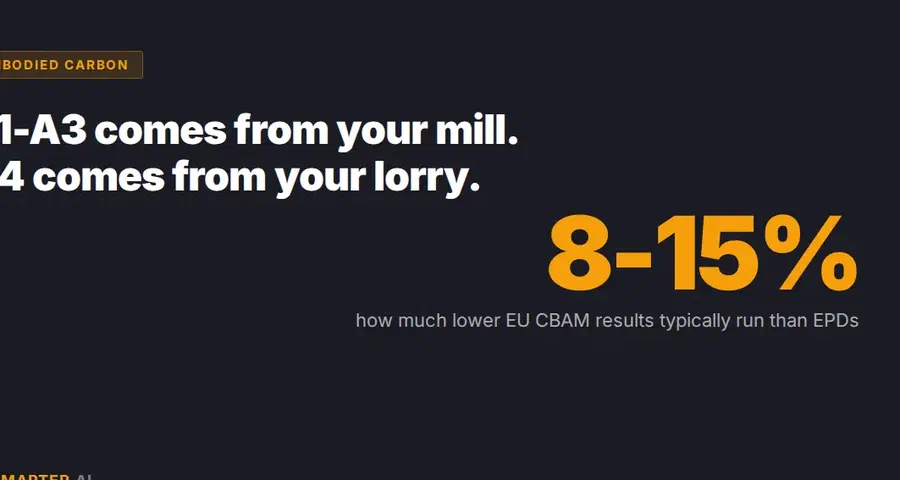
UK CBAM uses a narrower figure than an EPD. It covers direct emissions from making the goods and their precursors. An EPD’s A1-A3 GWP covers more. Research for DESNZ found EU CBAM results “typically 8-15% lower than EPD for the same product”. So never put a CBAM figure in an EPD answer, or the reverse. Keep them in separate records.
If you import steel or aluminium yourself, CBAM is a cost and a filing duty from January 2027. If you buy from a UK stockholder who imports, ask how they will handle it in their prices.
Risks to watch
- Expired EPDs. Check the date before every submission.
- Mismatched EPDs. A figure for the wrong mill, route or product misstates the order. The heat number is your proof of match.
- Sector averages passed off as product data. The London guidance prefers manufacturer data. Sector data suits early design only.
- Netting off module D. It flatters the figure. Keep it on its own line.
From scramble to repeatable bid response
Without a register, each questionnaire means hunting for documents and rebuilding tonnages. With one, you rerun the same sum on new orders, and your answers stay consistent between bids. We found no published figures on cost or margin effects, so we won’t guess.
Checklist
- Current EN 15804 EPD on file for every product line you buy
- Expiry dates in the diary, with a three-month warning
- Heat numbers linked to certificates, stock and orders
- Scrap logged by job and heat at the point of work
- Delivery distance, vehicle and load recorded per job
- Conversion factor edition and row recorded
- A1-A3, A4 and module D kept on separate lines
- CBAM data held apart from EPD data
- One named person signs off each figure
What to do this quarter
- Rank your suppliers by tonnage. Ask the top five for current EPDs.
- Build the EPD register. One row per EPD, with dates and a link to the document.
- Pick one recent order. Run the sum by hand, end to end, and note every gap.
- Ask your three biggest customers what figure, basis and format they want.
- Start logging delivery data per job: distance, vehicle and fuel where you can.
- If you import directly, check your UK CBAM position before 1 January 2027.
FAQs
What is the difference between A1-A3 and A4 embodied carbon?
How do I calculate embodied carbon for a fabricated steel order?
Does scrap reduce or increase our embodied carbon figure?
Is embodied carbon reporting mandatory for UK fabricators?
Can I use our CBAM emissions figure to answer an EPD question?
Does GoSmarter calculate embodied carbon?
Related reading
- Beyond ISO 9001 and ASTM: The Metals Standards Guide You Actually Need
Structural steel work rarely runs on one standard. Here is every EN, ISO, API, and NORSOK rule that lands on a fabricator's desk, in plain English.
11 min read
- CBAM Explained: The Financial Case for Cutting Scrap
The steel industry faces increasing pressure to decarbonise, with the EU’s Carbon Border Adjustment Mechanism (CBAM) set to become a decisive factor …
3 min read
- Why PDF Mill Certificates Break Data Workflows
Re-keying PDF mill certificates breaks heat-number traceability. Learn how to validate, extract and link certificate fields to stock records.
9 min read
About the Author

Co-founder & Head of Product
Steph Locke is Co-founder and Head of Product at GoSmarter AI — former Microsoft Data & AI MVP building practical tools to cut paperwork and automate compliance for metals manufacturers.