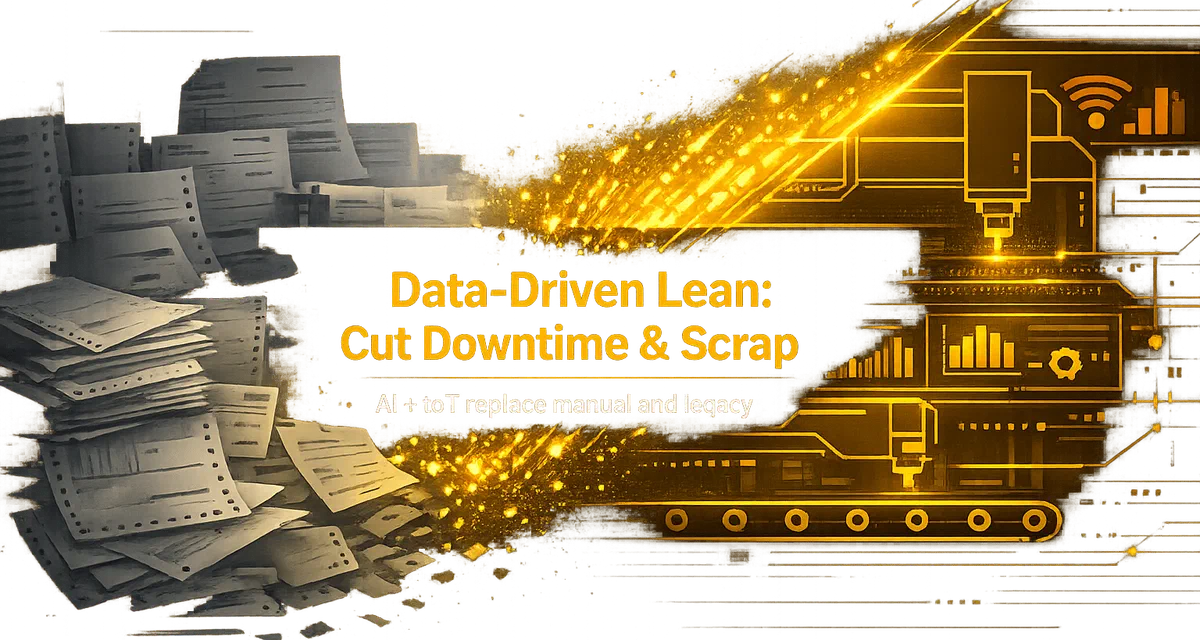
Your Factory Dashboard Is Missing These KPIs
- BlogSmarter AI
- Edited by Steph Locke
- Blog
- March 24, 2026
- Updated:
Table of contents Show Hide
Most metals businesses are tracking the right KPIs. They’re just tracking them two days too late. By the time an end-of-shift report lands on your desk, the scrap has gone in the skip, the mill cert is in the wrong folder, and the late delivery is already late. Real-time dashboards close that gap.
The 8 KPIs every metals manufacturer should track: Overall Equipment Effectiveness (OEE), throughput rate, scrap rate, first pass yield, On-Time-In-Full (OTIF) delivery, energy per tonne, embodied carbon per tonne, and cost per tonne. Track these in real time and you can see exactly where you’re losing money — before the shift ends.
The Old Way vs. The Smart Way
| The Old Way | The Smart Way |
|---|---|
| Manually tracking downtime and throughput | Real-time OEE and throughput monitoring |
| Guessing scrap rates and rework costs | AI-optimised cut lists reducing scrap by 20–50% — highest gains on long products like rebar [2] |
| Scrambling for mill certs during audits | Instant certificate extraction with AI |
Let’s break down the KPIs that matter most - OEE, scrap rates, energy efficiency, and cost per tonne - and how to build a dashboard that doesn’t just inform but transforms your operations.
Watch: OEE and KPIs Explained in Three Minutes
OEE, throughput, and yield are the three numbers that expose hidden losses most metals manufacturers never catch in time. This three-minute explainer shows why they matter and how to read them correctly.
Which Production Efficiency Metrics Should You Track?
Tracking production efficiency is the fastest way to find losses caused by downtime, slow cycles, or quality issues. These key performance indicators (KPIs) distinguish factories hitting their tonnage goals from those falling behind. They also set the stage for deeper insights into quality and waste management.
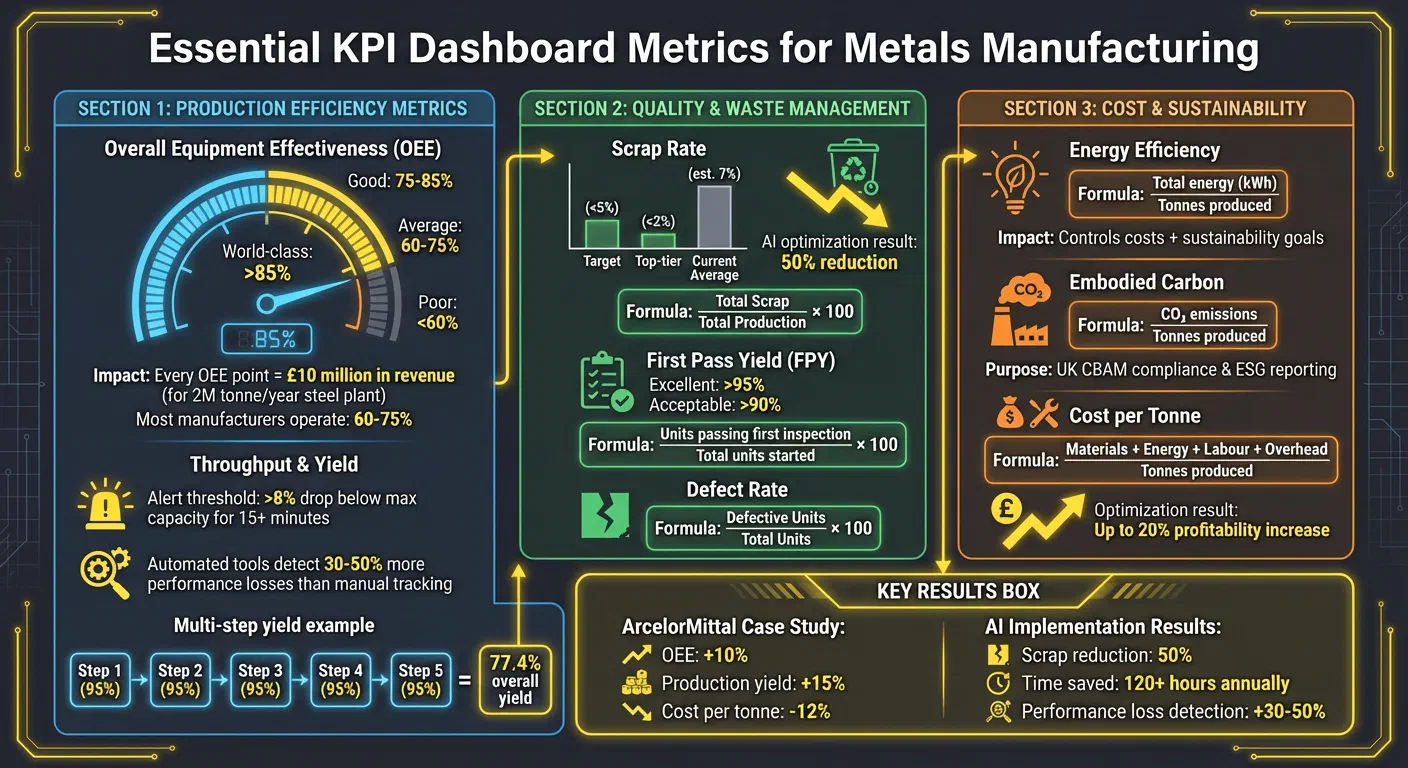
Overall Equipment Effectiveness (OEE)
OEE is the most critical number on your dashboard - it combines availability, performance, and quality into one percentage that reflects your actual capacity utilisation [4][5]. While 85% is considered world-class, most metals manufacturers operate between 60% and 75% [4]. For a steel plant producing 2 million tonnes a year, every OEE point represents about £10 million in revenue [6].
Display OEE in real time and you catch a problem in the first five minutes — not at the end-of-shift debrief. A loss waterfall visualisation can show exactly where capacity is being lost [7]. Often, the bottleneck lies in critical equipment like the continuous caster or hot strip mill - addressing these constraints can unlock higher throughput [6][5].
Throughput Rate
Throughput measures how many metric tonnes are produced per hour or shift, excluding scrap and rework. It’s a direct indicator of how well you’re using your equipment. For instance, if a rolling mill rated for 200 tonnes per hour only produces 140, you’re losing 60 tonnes of potential output every hour.
If throughput drops more than 8% below capacity for over 15 minutes, stop and find the cause [8]. That’s not a drift — that’s a problem. Real-time tracking helps uncover small stoppages and speed reductions that manual methods often miss. Automated tools typically detect 30% to 50% more performance losses than manual tracking [6][7]. Following throughput, assessing yield rate can give you a clearer picture of first-pass quality.
Yield Rate
Yield rate measures the percentage of metal meeting quality standards on the first pass, without requiring rework or repairs [4][1]. For example, if you produce 1,000 tonnes but only 850 are saleable, your yield rate is 85%, with 15% lost to waste. In multi-step processes like rolling and finishing, these losses can compound. For instance, a five-step process with a 95% yield at each step results in an overall yield of just 77.4% [4].
Pair yield rate with scrap and defect data and you’ll see exactly where quality breaks down and which process is to blame.
| OEE Level | What It Means | Typical Situation |
|---|---|---|
| >85% | World-class | Predictive maintenance and structured improvement programmes [4] |
| 75–85% | Good | Systematic improvement underway; among the top 25% of mills [4][7] |
| 60–75% | Average | Reactive maintenance culture with room for significant gains [4][7] |
| <60% | Poor | Fundamental equipment or process issues and frequent breakdowns [7] |
On-Time-In-Full (OTIF) Delivery
On-Time-In-Full (OTIF) measures the percentage of orders delivered complete and on the promised date. For service centres and fabricators, it is often the number that determines whether you keep a customer. Most metals businesses track it retrospectively — a spreadsheet updated after a delivery fails. By then, it is too late.
Real-time OTIF tracking means knowing today which jobs are at risk before they miss their date. That requires live visibility of what material is in stock, what is already committed to other orders, and whether the cutting schedule can deliver on time. When that data lives in disconnected spreadsheets, OTIF surprises are inevitable.
GoSmarter’s scheduling module shows live commitment status across all open jobs — which are on track, which are at risk, and which jobs are competing for the same material. Planners can act before a delivery slips rather than explain why it did.
Which Quality and Waste KPIs Matter Most?
Reducing waste and maintaining high-quality standards are constant challenges for any operation. Even when scrap metal prices are favourable, they rarely offset the combined costs of wasted materials and labour [9]. To gauge whether your operation is efficient or leaking profits, focus on these three KPIs. They complement production metrics by ensuring quality and minimising waste across shifts.
Scrap Rate
Scrap rate indicates the percentage of material that ends up unusable and cannot be salvaged. Ideally, most established operations aim to keep this below 5%, while top-tier plants often achieve rates under 2% [9][10]. A high scrap rate often points to issues with materials, equipment, or processes - such as misaligned fixtures, worn tools, or human errors in estimation [9].
Pareto charts can help you pinpoint which processes or machines are the main culprits for scrap [9]. For a deeper dive into benchmarks and reduction strategies, see the Scrap, Waste & Yield Optimisation hub.
For example, Midland Steel moved from manual cut planning to GoSmarter’s AI-driven Cutting Plans for rebar and structural sections. Scrap rate halved — recovering material per month that had previously been written off as offcut waste. Admin time dropped by over 120 hours a year: time that had been spent manually transcribing heat numbers and grades from PDF mill certificates into spreadsheets. With accurate, live stock data feeding their order commitments, the team also stopped over-ordering buffer stock to cover for planning uncertainty, cutting the working capital tied up in slow-moving bar. The whole change was live within a week [2].
Stop wasting raw material because someone guessed instead of measured [2].
Defect Rate
Defect rate measures the percentage of units with flaws, including those that can be repaired through rework. This metric is invaluable for identifying root causes, whether they stem from material inconsistencies, equipment malfunctions, or process deviations [14]. Real-time sensor data can detect issues like equipment drift or tool wear before they result in defects [9].
To reduce defects, investigate causes by machine, shift, or material batch. Standardising work instructions can help minimise variability, while preventive maintenance can address issues like misaligned fixtures or worn-out tools before they escalate [9].
First Pass Yield (FPY)
First Pass Yield goes a step further by measuring the percentage of products that pass quality checks on the first try without needing rework. An FPY above 95% is considered excellent, while anything over 90% is generally acceptable [11]. Achieving high FPY eliminates the “hidden factory” of rework, which drains extra labour, materials, energy, and accelerates equipment wear [11][12].
Consider a steel service centre processing structural sections and flat plate. By fitting IoT sensors at entry and exit points on each production line, the team identifies exactly which cut or forming step is generating the most rejects. Statistical process control (SPC) charts highlight tool wear trends before parts go out of spec [13]. Incorporating FPY data into your dashboards allows for immediate adjustments, bringing quality control in line with live production. For a five-step line with 95% yield at each stage, the overall FPY is just 77.4% [4] — tracking each step separately shows you exactly where to focus first.
| Metric | What It Measures | Formula |
|---|---|---|
| Scrap Rate | Percentage of unusable production that cannot be reworked | (Total Scrap / Total Production) × 100 [9] |
| Defect Rate | Percentage of units with any defects (including reworkable ones) | (Defective Units / Total Units) × 100 [9] |
| First Pass Yield | Percentage of units passing inspection on the first attempt | (Units passing first inspection / Total units started) × 100 [9] |
Which Cost and Sustainability Metrics Should You Track?
Efficiency and quality only tell half the story. Cost and sustainability KPIs protect your margins and keep you on the right side of UK CBAM and ESG requirements. These metrics track production costs, energy consumption, and compliance — key elements increasingly required for ESG reporting.
Energy Efficiency (kWh per Tonne)
Energy efficiency measures how many kilowatt-hours are used to produce one tonne of metal. This metric impacts both your production costs and carbon footprint[3]. To calculate it, divide the total energy consumed by the tonnes of metal produced. If energy use increases, it could point to outdated equipment or poor production scheduling. Dashboards that break down energy consumption by shift or production line can help you identify and address inefficiencies[3][18]. Tracking embodied carbon alongside energy use ensures you stay on target for regulatory compliance and sustainability goals.
Embodied Carbon per Tonne
Embodied carbon measures the CO₂ emissions generated per tonne of metal produced. Fail a CBAM audit and you face import duties based on estimated — not actual — carbon content. Estimated carbon is always worse than measured. Companies relying on manual cert processing are one audit away from finding that out the hard way. Tracking embodied carbon per tonne is how you build the evidence trail before the auditor arrives[13][16]. Calculating embodied carbon manually from mill certificates can be slow and prone to errors.
For a full guide on automating certificate handling, see the Mill Certificate Automation hub.
GoSmarter’s MillCert Reader does more than extract numbers. When a PDF cert arrives — scanned, emailed, or downloaded from a supplier portal — GoSmarter reads the heat number, grade, spec, and mechanical properties, then checks them against your purchase order automatically. If something does not match, it flags the non-conformance before the material reaches the floor.
The cert stays linked to the stock record, the cut job, and the delivery note. When CBAM or a customer audit asks for material provenance, you are not scrambling through a filing cabinet.
Companies using AI-driven cutting plans have seen scrap rates drop by 20–50%, boosting margins while reducing embodied carbon per tonne of finished products[2][15]. Alongside emissions metrics, monitoring production costs per tonne is vital for maintaining profitability.
Cost per Tonne
Cost per tonne is a simple but powerful metric: divide the total production costs - including materials, energy, labour, and overhead - by the tonnes produced[17]. This figure is critical for protecting margins. Dashboards can break down these costs by shift or production line, helping you spot inefficiencies. For example, if one shift consistently incurs higher costs, investigate whether setup inefficiencies, excessive scrap, or energy waste are to blame. Companies focusing on these financial KPIs have achieved profitability increases of up to 20%[17]. Tying cost per tonne to First Pass Yield is also effective - products that meet quality standards on the first attempt use less energy and materials than those requiring rework[18][3].
| Metric | Formula | Why It Matters |
|---|---|---|
| Energy Efficiency | Total energy consumed (kWh) / Tonnes produced | Controls operational costs and supports sustainability goals[3] |
| Embodied Carbon | CO₂ emissions / Tonnes produced | Essential for UK CBAM compliance and ESG reporting[13][16] |
| Cost per Tonne | (Materials + Energy + Labour + Overhead) / Tonnes produced | Protects margins and highlights cost drivers[17] |
How Do You Build a KPI Dashboard for Metals Manufacturing?
Creating an effective dashboard isn’t about cramming in every metric you can think of - it’s about giving your team access to the right numbers at the right time. The sweet spot? Around 8–10 key KPIs that align with your plant’s goals, whether it’s cutting downtime or slashing scrap rates [1]. Operators need live machine status and cycle times. Managers need OEE and cost-per-tonne trends. Build for both. These steps will help you customise a dashboard that works for everyone on your team.
| Spreadsheets | Generic BI (Power BI / Tableau) | GoSmarter | |
|---|---|---|---|
| Setup time | 1 day (then endless maintenance) | 4–12 weeks with IT support | 1 day from a CSV |
| Mill cert processing | Manual copy-paste | No built-in parser | Automatic — under 30 seconds |
| Real-time data | Only if someone updates it | Requires a data pipeline build | Live from day one |
| Metals-specific KPIs | Build yourself | Build yourself | OEE, scrap, OTIF, cost/tonne pre-built |
| CBAM audit trail | Manual filing | Data warehouse required | Cert linked to job, linked to delivery |
| Price | “Free” (but your time isn’t) | £1,000–£5,000/month + BI developer | From £300/month — no developer needed |
Choose the Right KPIs
Your dashboard should reflect the needs of different roles within your operation. For example:
- Operations managers: Focus on OEE, capacity utilisation, and scrap rate.
- Maintenance teams: Track downtime, MTBF (Mean Time Between Failures), MTTR (Mean Time to Repair), and maintenance costs per unit.
- Quality teams: Monitor metrics like First Pass Yield (aiming for 98% in top-performing plants), defect rates, and customer returns [19].
- Leadership: Look at revenue per employee and manufacturing costs as a percentage of revenue to evaluate workforce efficiency and financial performance.
The key here is actionability. A KPI is only useful if it drives decisions - otherwise, it’s just noise [20]. Once you’ve nailed down the metrics that matter, ensure they’re powered by real-time data.
Connect Real-Time Data Sources
GoSmarter adds intelligence to the systems you already use — not replace them. You can be live in a day from a CSV upload. Connecting to an ERP, MES, or IoT sensors via API is available when you are ready, but never a requirement for day one [5]. GoSmarter runs in the browser, hosted in the EU, and your data belongs to you.
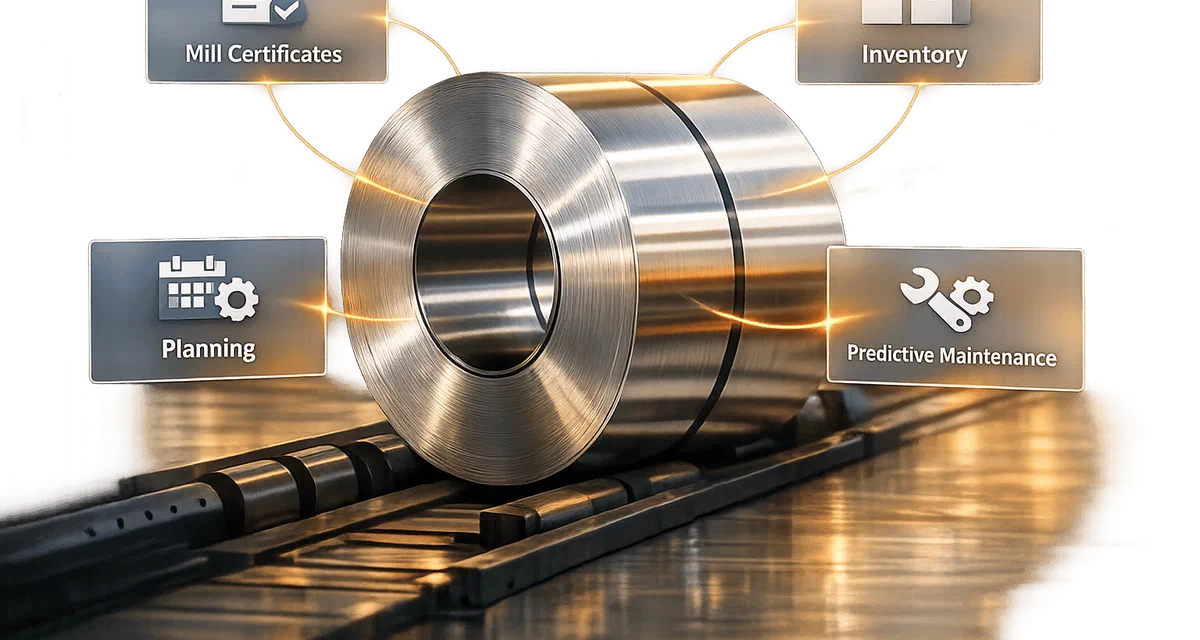
For real-time stock visibility, Metals Manager links your stock records, mill certs, and open orders — showing exactly what material is available, committed, and due for delivery. To see how AI cut-planning fits in, visit the Cutting Optimisation hub.
GoSmarter’s MillCert Reader uses AI to pull data straight from mill certificates — scanned or digital — without any manual typing [2]. Set up threshold alerts via SMS or email when critical metrics like downtime or scrap rates exceed acceptable limits [5]. Tackle issues as they arise, not after the fact.
Design Clear Visualisations
Once your data is flowing in real time, the next challenge is presenting it in a way that’s easy to understand. Use visual tools that make performance gaps obvious at a glance:
- Gauges: Ideal for real-time metrics like OEE.
- Line charts: Great for tracking trends over time.
- Pareto charts: Pinpoint the main causes of defects or downtime [1].
Add colour-coding (red, yellow, green) to flag urgent issues like production delays or quality problems. Always include a “Target vs. Actual” comparison to help teams see immediately whether they’re hitting their goals [1]. Make sure the dashboard is mobile-friendly so shop floor operators can access it on the go [21].
For plant managers, the dashboard should allow for a quick “5-minute check” of both financial and production performance. Reliability engineers, on the other hand, need tools for deeper analysis of failure modes and asset health [22]. The design should reflect these varied needs, ensuring everyone gets the insights they require to act effectively.
Getting Your Team on Board
A dashboard only works if people use it. The biggest reason KPI projects stall is not the technology — it’s the conversation that never happened. Before you build, agree on which three metrics the MD will look at each morning and what action each one triggers.
Start with the operators. Show them how the dashboard makes their shift easier — fewer audit panics, faster cert retrieval, less back-and-forth on material availability. If operators trust the data, they will flag when something looks wrong. That feedback loop is what makes dashboards improve over time.
Roll out in phases. Begin with one data stream — usually mill certificate processing, because it has an immediate, visible payback. A metals business processing 30 PDFs a week typically spends 8–15 minutes per document on manual entry. That is 4 to 7.5 hours every week, or up to 390 hours a year. At £30/hour for an administrator, that is up to £11,700 annually before any error correction. GoSmarter’s MillCert Reader handles the same task in under 30 seconds. Add scheduling and OTIF tracking in week two or three. You do not need a systems integrator or a project manager to get started.
Getting Started: The 30-Day Path
Not sure where to start? Most GoSmarter customers begin with one data stream — usually mill certificates, because that is where the most manual effort lives. Once certs are being read automatically and flowing into your stock record, the KPIs that depend on material data (scrap rate, yield, cost per tonne) start updating without anyone typing. That typically takes a day to set up. Scheduling and live commitment tracking come next, usually in the second or third week. You do not need a systems integrator, a data warehouse, or a project manager. You need a CSV export of your current stock and an hour on a call.
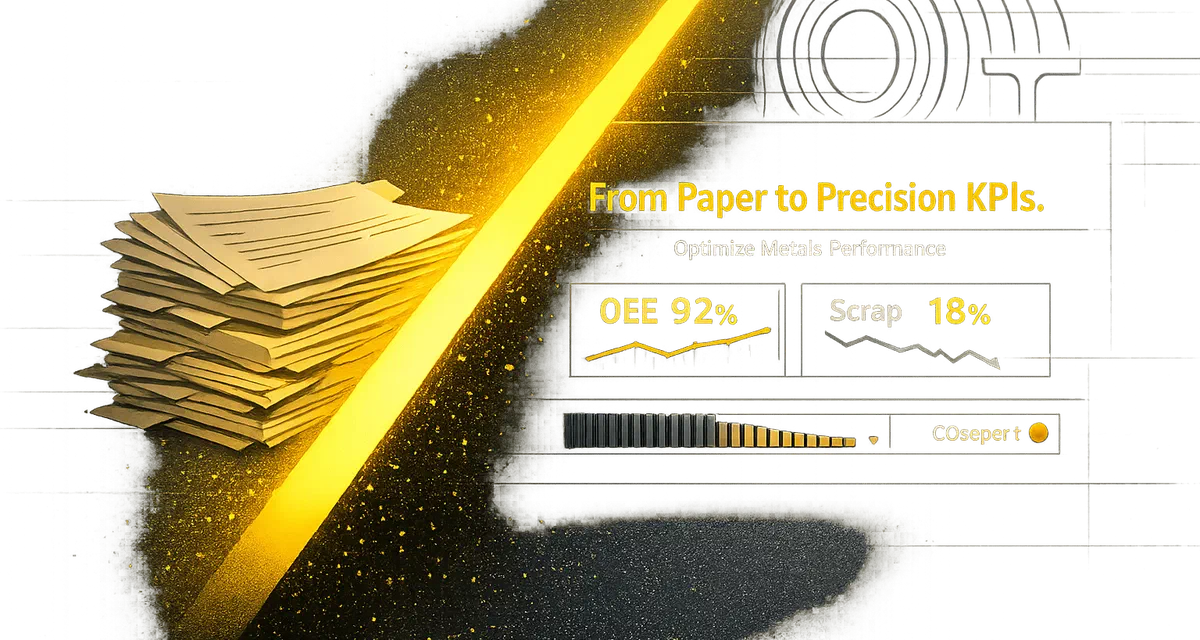
Stop Guessing. Build the Dashboard.
Pick 5–10 KPIs that match your plant’s goals: OEE, scrap rate, energy efficiency per tonne. That’s it. Everything else is noise[1]. Take ArcelorMittal as a case in point: by prioritising OEE, production yield, and cost per tonne, they achieved a 10% boost in OEE, a 15% increase in yield, and a 12% cut in production costs per tonne[17]. That’s the power of a dashboard that drives action, not just information.
Manual data tracking is a drain on resources. Tools like GoSmarter’s MillCert Reader eliminate this inefficiency, saving hundreds of hours annually by automatically extracting heat numbers and grades from mill certificates[2]. Similarly, AI-driven Cutting Plans typically reduce scrap rates by 20–50% — the largest gains come on long products like rebar and structural sections, where optimising cut sequences across mixed bar lengths can recover tonnes of material that would otherwise become offcut waste[2]. Your team can stop chasing data and start fixing the actual problem.
Modern dashboards go beyond recording metrics - they actively enhance performance. Real-time monitoring of metrics such as throughput, defect rates, and embodied carbon per tonne allows you to address potential issues before they snowball into costly problems. Companies optimising their financial KPIs have reported up to a 20% rise in profitability, while those prioritising operational efficiency have cut production costs by as much as 15%[17]. Raw metal alloy can make up over 50% of direct unit costs[23]. Even a 1% reduction in scrap goes straight to margin.
The metals sector is moving swiftly towards predictive maintenance, embedded analytics, and AI tools that turn raw machine data into decisions [5]. If you’re still relying on manual data entry and end-of-day reports, you’re not just outdated — you’re losing money. A dashboard that shows your team exactly what to fix — and when — is faster than any end-of-day report ever could be. Your competitors are already running these. Your spreadsheets are not a fair fight.
FAQs
Which 8–10 KPIs should I prioritise first?
Eight KPIs worth watching from day one:
- Production Throughput: How much you produce per shift. Your baseline for everything else.
- Scrap Rate: Waste as a percentage of total output. Below 5% is target; under 2% is world-class.
- Machine Downtime: How often equipment is out of action and for how long.
- Cycle Time: How long a production run takes from start to finish.
- Quality Yield: The percentage of product passing on the first pass — no rework.
- Energy Consumption: kWh per tonne. Tracks both cost and your carbon footprint.
- Safety Incidents: Workplace accidents. Non-negotiable to track.
- Inventory Levels: Stock on hand versus committed orders. Stops over-ordering and shortages.
These numbers are not just data — they’re the roadmap to smarter, leaner operations.
How do I calculate OEE correctly for a metals line?
OEE = Availability × Performance × Quality
Here’s how each component breaks down:
Availability: How much of the scheduled production time was actually used. (Scheduled production time - Downtime) ÷ Scheduled production time
Performance: How efficiently the equipment is running compared to its rated maximum. Actual production rate ÷ Maximum rated production rate
Quality: The proportion of good units produced. Good units produced ÷ Total units produced
Multiply the three ratios together to get OEE. Use real-time data for reliable results — end-of-shift reports introduce too much lag.
What data sources do I need for real-time dashboards?
Connect to three core systems: ERP (Enterprise Resource Planning), MES (Manufacturing Execution System), and SCADA (Supervisory Control and Data Acquisition). That gives you live production, quality, and machine data in one place.
Every feed should include timestamps and source tracking so your engineers can trace any data point back to its origin — vital when chasing a batch defect or preparing a CBAM audit. If you’re not there yet with full system integration, GoSmarter’s MillCert Reader works standalone from day one. Upload a stock CSV and your cert inbox, and you’re already tracking material KPIs without any infrastructure project.
When you’re ready to go further, GoSmarter connects to leading ERP and MES systems via API — no dedicated IT project required. You add the connection when it makes sense for your business, not because the platform demands it.