Digital Twins for Factory Workflow Analysis
- BlogSmarter AI
- Edited by Steph Locke
- Blog
- July 6, 2026
- Updated:
Table of Contents Show Hide
I see this all the time in metals plants. Workflow problems hide in the gaps between machines, then show up later as missed deliveries, scrap, overtime and cash burned for no good reason.
A digital twin gives you a live model of the line, so you can spot where flow is getting stuck and test fixes before you touch the plant. For metals manufacturers, that means using live machine data, routing rules, heat numbers and planning records to check line flow on screen first. If you already use GoSmarter, tools like Cutting Plans, MillCert Reader and Metals Manager help keep that input data clean enough to stop the model turning into another software fairy tale.
What you’ll get here:
- A plain-English view of how digital twins help find moving bottlenecks
- A short take on why spreadsheets miss blocked and starved stations
- A practical starting point for a pilot on one line or one queue
- A simple way to measure throughput, scrap, lead time and £ savings
Here’s how to fix it.
Digital Twins & Industrial Artificial Intelligence Applications for Manufacturing Workflow Efficiency
Where Your Line Actually Gets Stuck
In metals plants, the choke point usually shows up in the flow. Blocked cutting lines. Starved finishing stations. Crane delays. Slow changeovers. Inspection queues. Each one gums up the line in its own way, but the result is the same: throughput drops and the queue gets shoved downstream.
A machine is blocked when it has finished its cycle but the next station or buffer is full. In plain English, it’s waiting for the next step [3]. It is starved when it sits idle because upstream parts have not arrived. That means it’s waiting on supply from earlier in the line [3]. Fix one upstream issue and the bottleneck often pops up somewhere else, usually inspection or material handling [4].
Frequent bottlenecks mean overtime, expediting, and weaker delivery performance [6].
This is where plenty of plants get caught out. They tidy up one station, pat themselves on the back, then wonder why the line still feels slow. The problem is simple: pushing one station harder can dump more pressure on the next one and make overall flow worse [4]. A machine can look busy and healthy on its own while queues are stacking up somewhere else. Line performance matters more than machine uptime. That line-level mismatch is exactly what a digital twin shows before you touch the plant.
Why Spreadsheets Break Down When the Shop Floor Gets Busy
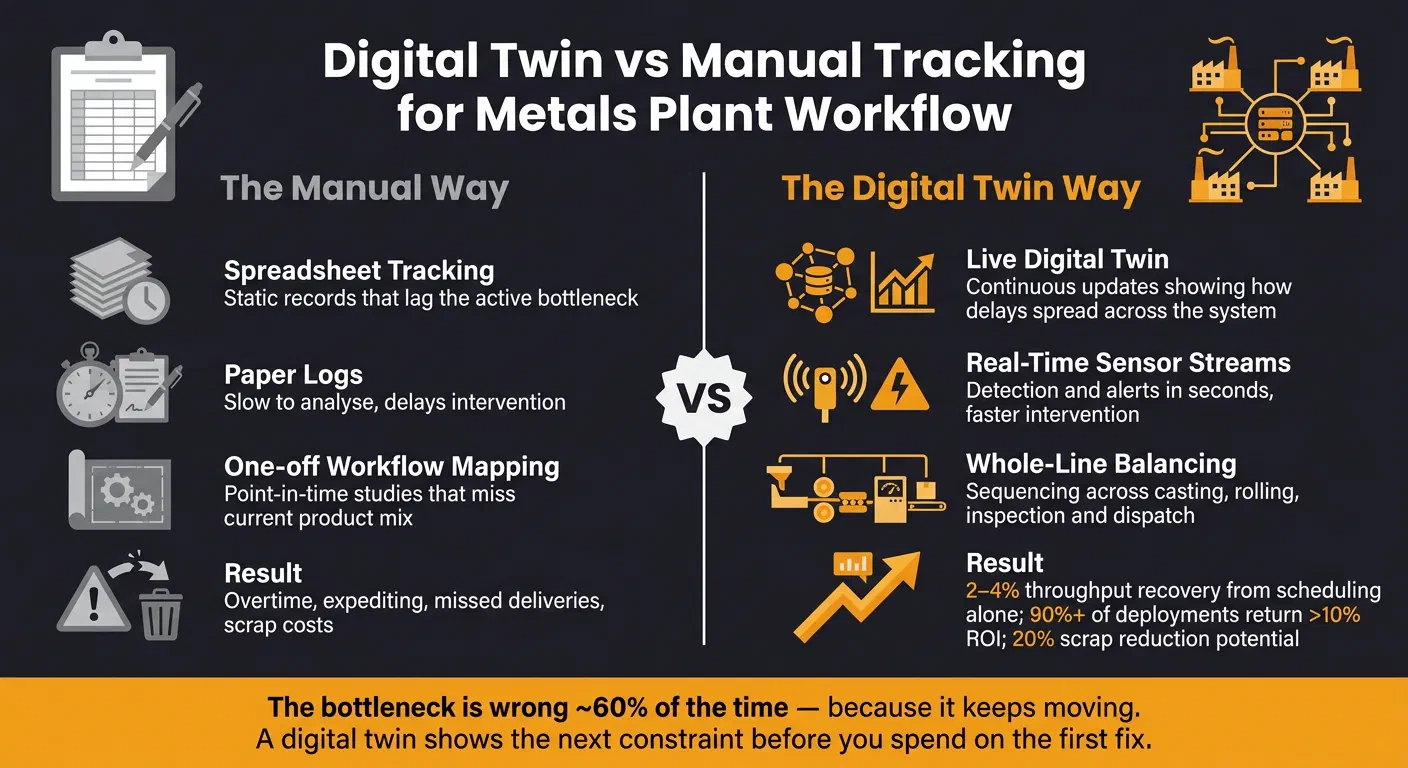
The problem with manual tracking is timing. Spreadsheets are static. They show fixed time periods, not what’s happening now. That becomes a mess when cycle times change with product mix, a maintenance window runs over, or one crane is being pulled across several bays at the same time. A static log shows what happened. It does not show where the next constraint is forming.
| The Manual Way | The Automated Way |
|---|---|
| Spreadsheet tracking: Static records that lag the active bottleneck [2][4][5] | Live digital twin: Continuous updates using live data to show how delays spread across the system [4][3] |
| Paper logs: Slow to analyse [2] | Real-time sensor streams: Detection and alerts in seconds, enabling faster intervention [2] |
| One-off workflow mapping: Point-in-time studies that miss current mix [2] | Whole-line balancing: Whole-line sequencing across casting, rolling, inspection and dispatch [2] |
The job is not just to record delays. It’s to see how one delay knocks the rest of the workflow out of shape.
How a Digital Twin Shows You the Problem Before You Touch the Plant
A factory digital twin mirrors your machines, material flow, labour, routing rules and queues using live production data. In a metals plant, that means you can see how work moves from furnace to dispatch. The model pulls in heat numbers, mill certificates, cutting plans, scrap records and routing rules across the line.
It shows where queues are building, where stations sit idle and where delays start rippling downstream. And let’s be honest, most plants don’t have one fixed bottleneck sitting there forever. The live constraint shifts with product mix, maintenance and demand. Once you can see that live constraint, you can test fixes on a screen instead of gambling on the shop floor.
That is the whole point. You try changes before anyone touches the plant. Change a shift pattern, add capacity or tweak batch sizes, and the twin shows the knock-on effect on throughput across the whole line.
What Data You Need to Build a Twin That People Will Trust
To make the model useful, start with the records your plant already has. A twin only works when the inputs are clean: process rules, machine signals and traceable material records.
| Data Input Category | Practical Examples for Metals | Purpose in the Twin |
|---|---|---|
| Production Logic | Cutting plans, routing rules, batch sizes | Defines how materials flow and how machines interact |
| Machine Data | programmable logic controller signals, downtime codes, Overall Equipment Effectiveness (OEE) history | Tracks real-time performance and equipment health |
| Material Records | Mill certificates, heat numbers, scrap records | Supports traceability and links material to process history |
PDF mill certificates, heat numbers and scrap records often live in separate spreadsheets. That mess makes it harder for engineers to trust the twin. GoSmarter helps metals manufacturers turn that scattered data into clean, model-ready inputs by digitising mill certificates, linking heat codes to inventory, and pulling scrap and order records into planning data you can actually use.
Why Legacy Systems Are Not a Barrier to Getting Started
You do not need a full system rip-out to begin. UK plants can start using digital twin methods without replacing the infrastructure they already rely on. A useful twin can sit on top of your current setup, pulling data from older supervisory control and data acquisition and control systems without forcing a full replacement.
The sensible place to start is with the records already sitting in your business: equipment specs, process spreadsheets and CAD exports. Build the model around one constrained area, check it against actual output data, then expand once it matches what the plant is doing.
Fix the Bottleneck on Screen First, Not on the Shop Floor
Once you trust the model, use it to test fixes before you touch the line. Trialling changes on a live production line burns cash fast. A shift pattern tweak that looks fine on paper can clog a furnace queue within hours. A buffer change that seemed safe can leave a downstream station short by the end of the shift. A digital twin cuts that risk. Your operations team can test schedule, staffing, routing and layout changes in a virtual line, then see the flow impact before making changes on the floor.
The idea is simple: test the change virtually, then roll out the version that improves flow.
3 Workflow Problems You Can Test in a Digital Twin This Week
The first is a casting bottleneck. If a caster processes 7,200 tonnes per day while the blast furnace is producing 8,000 tonnes per day, the caster becomes the constraint and the queue starts building straight away [1]. The twin lets you test whether an extra shift, a resequenced batch order or a buffer change clears that queue, without stopping the line just to learn the hard way.
The second is furnace loading patterns that create idle time. If a reheating furnace delivers 520 tonnes per hour but the hot strip mill is rated at 600 tonnes per hour, the mill sits idle for about 12 minutes every hour [1]. Simulating different loading sequences and dwell times helps you find the pattern that keeps the mill fed without overloading the furnace.
The third is internal transport delays between bays. A finishing line processing 40 coils per shift cannot hold that pace if the cooling bed only stages 34. The queue pushes back into the mill and forces holds [1]. Testing a revised transport schedule or a staging layout change in the twin helps you sort that out without knocking throughput on the floor.
These tests show which change lifts throughput without just shoving the bottleneck somewhere else.
What Happens to the Bottleneck After You Fix the First One
This is where plenty of teams get caught out. Fix one constraint, and the next one shows up in inspection, dispatch or material handling. That is not failure. That is exactly what should happen. It has a name: constraint migration [1].
“The plant’s understanding of its own bottleneck is wrong approximately 60% of the time… because the bottleneck moves. It moves when the product mix changes. It moves when maintenance takes equipment offline.” - John Mark, Industry Expert [1]
The twin earns its keep here because it shows you the next constraint before you commit to the first fix. Operations directors can use that view to plan staged improvements in sequence, balancing upstream and downstream capacity instead of patching isolated pain points. Put bluntly: the twin shows the next constraint before you spend on the first fix.
That sets up a live test using plant data.
Run One Live Workflow Test Using GoSmarter Data
Use the next constraint your twin shows you to pick the first pilot. Scheduling is usually the fastest place to start because you can fix flow without buying new kit. In practice, scheduling optimisation can recover 2–4% throughput just by resequencing the work you already run [1].
Start where sequencing choices create the biggest queue. Export your current cutting plans and sequences into a simple single-line model. Map material flow, cycle times, and capacity limits. Nothing fancy. Just enough to show where the line gums up. A single-line pilot usually takes three to six months to give you action you can use [1].
If your team still keys in mill certificates by hand, that’s old-school admin pain you don’t need. Use GoSmarter’s MillCert Reader and Metals Manager to digitise heat codes and tighten traceability. That helps with grade-change checks and can cut scrap by up to 20% [7].
Then run a live test:
- Put a batch of mill certificates through GoSmarter’s MillCert Reader
- Time the manual entry process
- Track how many fields need fixing after entry
- In parallel, use Cutting Plans data to test a planned 72-hour outage on the bottleneck
- Watch how queues shift and how recovery time changes [1][7]
Measure queue length, correction rate, and recovery time against your current baseline. That gives you a clean before-and-after, not hand-waving.
Conclusion: Start Small, Measure Clearly and Scale What Works
Factory workflow problems stay hidden because the data is scattered, and the bottleneck keeps shifting. One week it’s the saw. Next week it’s packaging. Then it’s the press line because a job overran and nobody spotted it early enough. A digital twin shows you where the constraint is before you start changing the plant.
Once you can see the constraint, the next step is simple: does fixing it pay back, or are you just moving the mess around?
The numbers are hard to ignore. Over 90% of digital twin deployments return more than 10% Return on Investment (ROI), with more than half beating 20% [2]. A three- to six-month pilot on one bottleneck in a single critical line gives you clean before-and-after data on throughput, lead time, scrap and £ savings [1]. That gives you proof, not guesswork.
That makes the first live pilot practical, not theoretical.
For UK metals manufacturers, the path is pretty direct. Pick one bottleneck where your gut says there’s a constraint, but the numbers still don’t prove it. Feed the model clean production data: accurate timestamps, real cycle times and actual mean time to recovery figures. Then measure the result against your current baseline in terms you already care about:
- tonnes per day
- lead time in hours
- scrap as a percentage
- the £ value of the change
If you use GoSmarter’s MillCert Reader and Cutting Plans, use them to keep certificate data and scheduling inputs clean while you build that baseline.
Once the first win is documented, the twin becomes a shared reference point for planners, engineers and operations leads. It cuts down the usual debates driven by incomplete data and half-finished spreadsheets [4]. Start with one bottleneck. Measure clearly. Then scale what works.
FAQs
What is a digital twin in a factory?
A digital twin is a live, virtual copy of a physical system, such as a machine, production line or whole factory.
It is not just a static model gathering dust in a folder. It updates with real-time data, so it shows what is happening now, not what happened last week. That lets engineers watch operations, spot bottlenecks and test changes safely before they touch the shop floor.
How do I start a pilot without replacing legacy systems?
Take the sensible route: run the digital twin as a layer on top of the systems you already have. You do not need to rip out legacy kit or kick off some giant Internet of Things (IoT) programme that eats budget and patience.
Start small. Pick one high-value asset or one production line where the bottlenecks are already plain to see. Build a shadow model that reads data from your existing programmable logic controllers, enterprise resource planning systems and computerised maintenance management system records. Then use GoSmarter to pull usable data from the files you already deal with.
Keep the first step tight. Aim for a 2 to 6-week pilot before you scale it bit by bit.
What data matters most for a trusted workflow model?
A trusted workflow model needs clean, accurate, joined-up data that stays in sync with the physical shop floor in near real time.
That means pulling in production data from programmable logic controllers and Manufacturing Execution System (MES) platforms, along with inventory levels, material travel times, equipment failure history, consistent timestamps, and tight governance. If your data is a mess, the twin stops being a decision tool and turns into just another static report.
Drill deeper
- Digital Twins in Metals Manufacturing: A Complete Guide
Go here for standards, data foundations and a full pilot plan.
24 min read
About the Author

Editor· Co-founder & Head of Product
Steph Locke is Co-founder and Head of Product at GoSmarter AI — former Microsoft Data & AI MVP building practical tools to cut paperwork and automate compliance for metals manufacturers.